Hear the story of a nation through data visualization

A story of a nation is told through the data visualization of the country's GDP. visualization of country like never before.

"Data is not the end of the conversation, it is the beginning of one"

- Authors, Data Visulization Storytelling using data [Page.No 206]

What is GDP ?
Why GDP ?

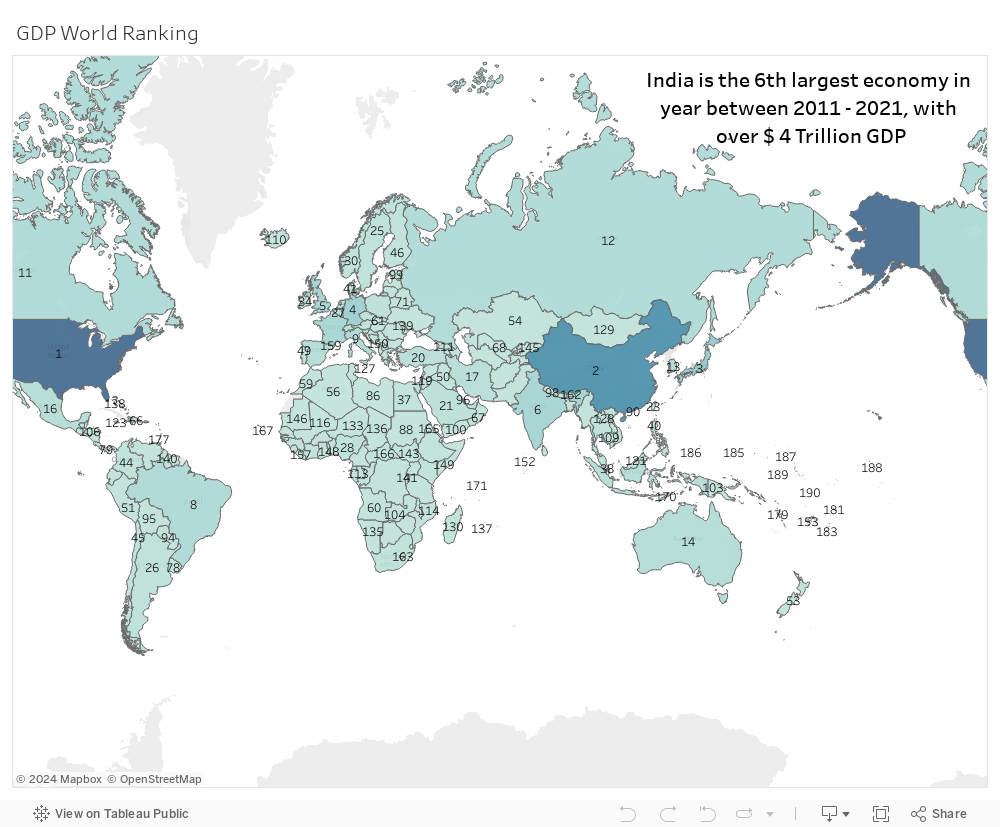
GDP stands for Gross Domestic Product and it is the total value of goods and services produced within a country's borders over a specific period of time (usually a year). It's a measure of a country's economic output and is often used to gauge the health of an economy.

GDP is important because it provides a way to compare the economic performance of different countries and track changes in economic activity over time. It's also used by policymakers to make decisions about fiscal and monetary policies that can affect economic growth and employment.

- Source IMF GROSS DOMESTIC PRODUCT: AN ECONOMY’S ALL

How does the Global GDP looks like ?

Findings

  • ➤ United States of America is the largest economy in the world

  • ➤ China is the second largest economy in the world

  • ➤ India is the 6'th largest economy in the World

  • ➤ India accounted for 7.2% of global economy in 2022

  • ➤ India's GDP is expected to grow at 7.5% in 2022

Source

How much GDP Indians States Generate Individually ?

Findings

  • ➤ Maharashtra has the highest GDP in India

  • ➤ Tamil Nadu is the next state with highest contribution to India's GDP

  • ➤ States in the North-Eastern region of India have the lowest GDP, with Nagaland and Manipur being the lowest contributors

  • ➤ Bihar's GDP growth rate increased from 11.3% in 2011-12 to 17.1% in 2012-13, while Andhra Pradesh's growth rate increased from 9.9% in 2012-13 to 16.4% in 2013-14. Gujarat's GDP growth rate was consistently high during 2011-2017, with an average growth rate of 12.7%.

Source

How much different sectors contribute to India's GDP ?

Findings

  • ➤ Services Sector: The services sector is the largest contributor to India's GDP, accounting for more than 50% of the country's GDP.

  • ➤ Manufacturing Sector: The manufacturing sector is the second-largest contributor to India's GDP, accounting for around 25% of the country's GDP.

  • ➤ Overall, the services sector remains the key driver of India's economic growth, followed by the manufacturing and agriculture sectors.

Source

"The most powerful person in the world is a story teller. The story teller sets the vision, values and agenda of an entire generation that is to come."

- Steve Jobs, Founder CEO of Apple (1955-2011), Data Visualization Storytelling using data [Page.No 194]

Setting Vision of India through Visualization

Findings

  • ➤ The then Finance Minister P. Chidambaram had set a vision for India's economy through his budget speech in 2014 - 2015 Feb

  • ➤ The Finance Ministers budget speech is a collection of words, which can be used to create a word cloud.

  • ➤ The word cloud is a visualization of the most frequently used words in the speech.

  • ➤ It was found that the most frequently used words in the speech were "India", "Economy", "Ministry", "Manufacturing"

  • ➤ Clearly, the Finance Minister's vision for India's economy was to make India a manufacturing hub. This vision was set in 2014 - 2015 Feb. The vision was achieved in 2019. India became the world's 5th largest manufacturing country.

Source

Word Cloud Generation

Chidambaram img 1
Chidambaram img 2
Chidambaram img 3

Visualizing the Growth of Manufacturing Sector

Findings

  • ➤ The manufacturing sector in India has grown at an average annual rate of 7.4% from 2011 to 2021

  • ➤ The government's "Make in India" initiative launched in 2014 aimed to increase the contribution of the manufacturing sector to India's GDP to 25% by 2025

  • ➤ The Indian government's efforts to increase foreign investment in the manufacturing sector through initiatives such as "Invest India" and liberalization of the FDI policy have resulted in a significant increase in FDI inflows into the manufacturing sector.

  • ➤ The COVID-19 pandemic had a significant impact on the manufacturing sector in India, with disruptions to supply chains and reduced demand, leading to a contraction in the sector in 2020. However, the sector has shown signs of recovery in 2021.

Source

Growth of Manufacturing Sector Vs Co2 Emission

Findings

  • ➤ Manufacturing sector grew at an average annual rate of 7.4%, while CO2 emissions from the sector increased at an average annual rate of 4.6%.

  • ➤ India has pledged to reduce carbon emissions intensity by 33-35% by 2030, but rapid growth in manufacturing may make it challenging.

  • ➤ The government has launched initiatives to promote sustainable manufacturing and reduce emissions, but impact is yet to be seen.

  • ➤ Transportation, agriculture, and residential sectors also contribute to India's overall emissions.

Source

Gephi